Transforme sua carreira com análise de dados

Cursos de Excel, Power BI, Python e SQL para profissionais de diversas áreas.

Transformando carreiras com tecnologia.

Na Academia Clássica de Tecnologias, oferecemos formação profissional em análise de dados, com cursos práticos e estágios supervisionados, preparando-o para o mercado de trabalho

A computer screen displaying a coding interface with Python code related to machine learning. The code imports libraries like sklearn and deals with model metrics such as precision and recall. A classification report is shown along with a section titled 'Different meta model trained' listing various models like DT, RF, LR, and XGB. Below, there is code for tuning an XGB model using GridSearchCV.

150+

15

Mais de 500 alunos.

Cursos reconhecidos.

Serviços de Formação

Oferecemos cursos práticos em análise de dados e desenvolvimento de projetos para empresas.

Pacotes de Especialização
A computer screen displaying analytics dashboards with various charts, including a line graph on the left and a cohort analysis table on the right. The table is populated with different shades of blue, indicating varying levels of user activity over several weeks. Text labels and numbers detail user retention statistics.

Formação em Excel, Power BI, Python, SQL e ETL para profissionais de dados.

Treinamentos Específicos

Análise de dados aplicada à contabilidade, gestão e logística para empresas e profissionais.

Estágios Supervisionados Disponíveis

Experiência Prática Garantida

Entre em Contato Conosco

Estamos aqui para ajudar com suas dúvidas e necessidades.
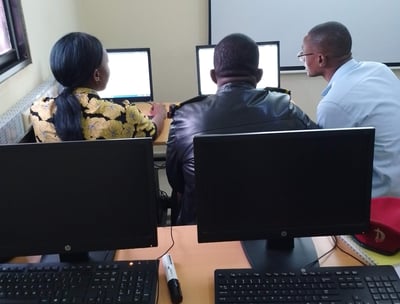
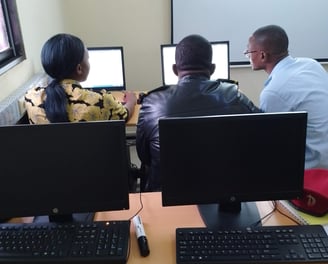
A digital screen displaying analytical data with line graphs, histograms, and numerical values. The data is presented in a user-friendly interface with different shades of blue used to distinguish various elements.
A person is viewing a map with red data points on a computer monitor, likely indicating a geographical distribution. The image has a focus on technology and data analysis.

Galeria

Explore nossos cursos e projetos em análise de dados e tecnologia.